Long/Short/Exit/Risk management Strategy # LongShortExit Strategy Documentation
## Overview
The LongShortExit strategy is a versatile trading system for TradingView that provides complete control over entry, exit, and risk management parameters. It features a sophisticated framework for managing long and short positions with customizable profit targets, stop-loss mechanisms, partial profit-taking, and trailing stops. The strategy can be enhanced with continuous position signals for visual feedback on the current trading state.
## Key Features
### General Settings
- **Trading Direction**: Choose to trade long positions only, short positions only, or both.
- **Max Trades Per Day**: Limit the number of trades per day to prevent overtrading.
- **Bars Between Trades**: Enforce a minimum number of bars between consecutive trades.
### Session Management
- **Session Control**: Restrict trading to specific times of the day.
- **Time Zone**: Specify the time zone for session calculations.
- **Expiration**: Optionally set a date when the strategy should stop executing.
### Contract Settings
- **Contract Type**: Select from common futures contracts (MNQ, MES, NQ, ES) or custom values.
- **Point Value**: Define the dollar value per point movement.
- **Tick Size**: Set the minimum price movement for accurate calculations.
### Visual Signals
- **Continuous Position Signals**: Implement 0 to 1 visual signals to track position states.
- **Signal Plotting**: Customize color and appearance of position signals.
- **Clear Visual Feedback**: Instantly see when entry conditions are triggered.
### Risk Management
#### Stop Loss and Take Profit
- **Risk Type**: Choose between percentage-based, ATR-based, or points-based risk management.
- **Percentage Mode**: Set SL/TP as a percentage of entry price.
- **ATR Mode**: Set SL/TP as a multiple of the Average True Range.
- **Points Mode**: Set SL/TP as a fixed number of points from entry.
#### Advanced Exit Features
- **Break-Even**: Automatically move stop-loss to break-even after reaching specified profit threshold.
- **Trailing Stop**: Implement a trailing stop-loss that follows price movement at a defined distance.
- **Partial Profit Taking**: Take partial profits at predetermined price levels:
- Set first partial exit point and percentage of position to close
- Set second partial exit point and percentage of position to close
- **Time-Based Exit**: Automatically exit a position after a specified number of bars.
#### Win/Loss Streak Management
- **Streak Cutoff**: Automatically pause trading after a series of consecutive wins or losses.
- **Daily Reset**: Option to reset streak counters at the start of each day.
### Entry Conditions
- **Source and Value**: Define the exact price source and value that triggers entries.
- **Equals Condition**: Entry signals occur when the source exactly matches the specified value.
### Performance Analytics
- **Real-Time Stats**: Track important performance metrics like win rate, P&L, and largest wins/losses.
- **Visual Feedback**: On-chart markers for entries, exits, and important events.
### External Integration
- **Webhook Support**: Compatible with TradingView's webhook alerts for automated trading.
- **Cross-Platform**: Connect to external trading systems and notification platforms.
- **Custom Order Execution**: Implement advanced order flows through external services.
## How to Use
### Setup Instructions
1. Add the script to your TradingView chart.
2. Configure the general settings based on your trading preferences.
3. Set session trading hours if you only want to trade specific times.
4. Select your contract specifications or customize for your instrument.
5. Configure risk parameters:
- Choose your preferred risk management approach
- Set appropriate stop-loss and take-profit levels
- Enable advanced features like break-even, trailing stops, or partial profit taking as needed
6. Define entry conditions:
- Select the price source (such as close, open, high, or an indicator)
- Set the specific value that should trigger entries
### Entry Condition Examples
- **Example 1**: To enter when price closes exactly at a whole number:
- Long Source: close
- Long Value: 4200 (for instance, to enter when price closes exactly at 4200)
- **Example 2**: To enter when an indicator reaches a specific value:
- Long Source: ta.rsi(close, 14)
- Long Value: 30 (triggers when RSI equals exactly 30)
### Best Practices
1. **Always backtest thoroughly** before using in live trading.
2. **Start with conservative risk settings**:
- Small position sizes
- Reasonable stop-loss distances
- Limited trades per day
3. **Monitor and adjust**:
- Use the performance table to track results
- Adjust parameters based on how the strategy performs
4. **Consider market volatility**:
- Use ATR-based stops during volatile periods
- Use fixed points during stable markets
## Continuous Position Signals Implementation
The LongShortExit strategy can be enhanced with continuous position signals to provide visual feedback about the current position state. These signals can help you track when the strategy is in a long or short position.
### Adding Continuous Position Signals
Add the following code to implement continuous position signals (0 to 1):
```pine
// Continuous position signals (0 to 1)
var float longSignal = 0.0
var float shortSignal = 0.0
// Update position signals based on your indicator's conditions
longSignal := longCondition ? 1.0 : 0.0
shortSignal := shortCondition ? 1.0 : 0.0
// Plot continuous signals
plot(longSignal, title="Long Signal", color=#00FF00, linewidth=2, transp=0, style=plot.style_line)
plot(shortSignal, title="Short Signal", color=#FF0000, linewidth=2, transp=0, style=plot.style_line)
```
### Benefits of Continuous Position Signals
- Provides clear visual feedback of current position state (long/short)
- Signal values stay consistent (0 or 1) until condition changes
- Can be used for additional calculations or alert conditions
- Makes it easier to track when entry conditions are triggered
### Using with Custom Indicators
You can adapt the continuous position signals to work with any custom indicator by replacing the condition with your indicator's logic:
```pine
// Example with moving average crossover
longSignal := fastMA > slowMA ? 1.0 : 0.0
shortSignal := fastMA < slowMA ? 1.0 : 0.0
```
## Webhook Integration
The LongShortExit strategy is fully compatible with TradingView's webhook alerts, allowing you to connect your strategy to external trading platforms, brokers, or custom applications for automated trading execution.
### Setting Up Webhooks
1. Create an alert on your chart with the LongShortExit strategy
2. Enable the "Webhook URL" option in the alert dialog
3. Enter your webhook endpoint URL (from your broker or custom trading system)
4. Customize the alert message with relevant information using TradingView variables
### Webhook Message Format Example
```json
{
"strategy": "LongShortExit",
"action": "{{strategy.order.action}}",
"price": "{{strategy.order.price}}",
"quantity": "{{strategy.position_size}}",
"time": "{{time}}",
"ticker": "{{ticker}}",
"position_size": "{{strategy.position_size}}",
"position_value": "{{strategy.position_value}}",
"order_id": "{{strategy.order.id}}",
"order_comment": "{{strategy.order.comment}}"
}
```
### TradingView Alert Condition Examples
For effective webhook automation, set up these alert conditions:
#### Entry Alert
```
{{strategy.position_size}} != {{strategy.position_size}}
```
#### Exit Alert
```
{{strategy.position_size}} < {{strategy.position_size}} or {{strategy.position_size}} > {{strategy.position_size}}
```
#### Partial Take Profit Alert
```
strategy.order.comment contains "Partial TP"
```
### Benefits of Webhook Integration
- **Automated Trading**: Execute trades automatically through supported brokers
- **Cross-Platform**: Connect to custom trading bots and applications
- **Real-Time Notifications**: Receive trade signals on external platforms
- **Data Collection**: Log trade data for further analysis
- **Custom Order Management**: Implement advanced order types not available in TradingView
### Compatible External Applications
- Trading bots and algorithmic trading software
- Custom order execution systems
- Discord, Telegram, or Slack notification systems
- Trade journaling applications
- Risk management platforms
### Implementation Recommendations
- Test webhook delivery using a free service like webhook.site before connecting to your actual trading system
- Include authentication tokens or API keys in your webhook URL or payload when required by your external service
- Consider implementing confirmation mechanisms to verify trade execution
- Log all webhook activities for troubleshooting and performance tracking
## Strategy Customization Tips
### For Scalping
- Set smaller profit targets (1-3 points)
- Use tighter stop-losses
- Enable break-even feature after small profit
- Set higher max trades per day
### For Day Trading
- Use moderate profit targets
- Implement partial profit taking
- Enable trailing stops
- Set reasonable session trading hours
### For Swing Trading
- Use longer-term charts
- Set wider stops (ATR-based often works well)
- Use higher profit targets
- Disable daily streak reset
## Common Troubleshooting
### Low Win Rate
- Consider widening stop-losses
- Verify that entry conditions aren't triggering too frequently
- Check if the equals condition is too restrictive; consider small tolerances
### Missing Obvious Trades
- The equals condition is extremely precise. Price must exactly match the specified value.
- Consider using floating-point precision for more reliable triggers
### Frequent Stop-Outs
- Try ATR-based stops instead of fixed points
- Increase the stop-loss distance
- Enable break-even feature to protect profits
## Important Notes
- The exact equals condition is strict and may result in fewer trade signals compared to other conditions.
- For instruments with decimal prices, exact equality might be rare. Consider the precision of your value.
- Break-even and trailing stop calculations are based on points, not percentage.
- Partial take-profit levels are defined in points distance from entry.
- The continuous position signals (0 to 1) provide valuable visual feedback but don't affect the strategy's trading logic directly.
- When implementing continuous signals, ensure they're aligned with the actual entry conditions used by the strategy.
---
*This strategy is for educational and informational purposes only. Always test thoroughly before using with real funds.*
Cari skrip untuk "take profit"

DVPOOverview
The DVPO (Dynamic Volume Profile Oscillator) Strategy is a comprehensive and highly customizable trading tool designed for precision and control. It is built around a unique, volume-driven oscillator that identifies potential market entries by analyzing the relationship between price, volume, and volatility.
This strategy is not just another signal generator; it's a complete framework that includes dynamic entry logic, adaptive risk management (ATR Stop Loss and R:R-based Take Profit), and a powerful dashboard of 10+ optional confirmation filters to help you tailor the strategy to your specific instrument, timeframe, and trading style.
The Core Concept: The DVPO Oscillator
The heart of this strategy is the DVPO oscillator. Unlike standard oscillators like RSI or Stochastics, the DVPO's primary goal is to quantify how far the current price has deviated from its recent volume-weighted "fair value."
Here’s how it works conceptually:
Micro Volume Profile: The indicator first analyzes a recent period of bars (defined by Lookback Period) to build a mini-profile of price and volume.
Volume-Weighted Mean: From this profile, it calculates a volume-weighted average price (VWAP) and the average deviation from that mean. This establishes the central point of value for the recent period.
Deviation Measurement: The oscillator's value is derived from how far the current price is from this calculated mean, scaled by the observed price deviation and a user-defined Sensitivity. A value above the midline suggests the price is trading at a premium, while a value below suggests it's at a discount.
Adaptive Volatility Zones: Instead of using fixed overbought/oversold levels (e.g., 70/30), the DVPO calculates dynamic upper and lower zones using the standard deviation of the oscillator itself. These zones expand and contract based on recent market volatility.
An entry signal is triggered not just when the oscillator is "overbought" or "oversold," but when it breaks out of these adaptive volatility zones, signaling that a statistically significant price movement is underway.
📈 Long Entry Condition : The oscillator crosses above the dynamic upper zone.
📉 Short Entry Condition : The oscillator crosses below the dynamic lower zone.
Integrated Risk & Trade Management
A signal is useless without proper risk management. This strategy has professional-grade risk management built directly into its logic.
Stop Loss (ATR-Based): The Stop Loss is not a fixed percentage. It is calculated using the Average True Range (ATR), allowing it to adapt automatically to the market's current volatility. In volatile periods, the stop will be wider; in quiet periods, it will be tighter.
Take Profit (Risk/Reward Ratio): The Take Profit level is calculated based on a user-defined Risk/Reward Ratio. If you set a ratio of 2.0, the Take Profit target will be placed at twice the distance of the Stop Loss from your entry price.
Dynamic Position Sizing: The strategy can automatically calculate the trade quantity for you. It determines the position size based on your specified Capital Size and the % Risk Per Trade you are willing to accept, ensuring disciplined risk control on every trade.
The Filter Dashboard : Enhance Your Signal Quality
To help reduce false signals and adapt to different market conditions, the strategy includes a comprehensive dashboard of optional confirmation filters. An entry signal will only be executed if it aligns with all the filters you have activated.
Trend & Momentum Filters :
T3, VMA, & VWAP Trend Filters: Utilize a suite of advanced moving averages (T3, Variable Moving Average, and a session-based VWAP) to ensure your trades are aligned with the dominant trend.
ADX Filter: Confirms that the market has sufficient directional strength for a trend-following trade, helping to avoid entries during choppy conditions.
Kaufman Efficiency Filter: Uses the Kaufman Efficiency Ratio to measure market noise. It only allows trades when the market is trending efficiently.
Volume & Market State Filters :
Volume Flow (VFI): A sophisticated volume-based filter that confirms whether volume is supporting the price move.
TDFI (Trader's Dynamic Index): A market state indicator designed to identify when the market is primed for a strong, directional move.
Flat Market Detector: A unique filter that identifies and avoids trading in sideways or ranging markets where trend strategies typically underperform.
Trade Condition Filters :
Min TP / Max SL %: Filter out trades where the risk/reward profile doesn't meet your minimum requirements (e.g., ignore a trade if the ATR-based stop loss is more than 10% away from the price).
Session Filters: Allows you to enable or disable trading on specific days of the week and to set a Cooldown Period (a set number of bars to wait after a trade closes before looking for a new entry).
How To Use This Strategy
Start with the Core: Begin by configuring the DVPO Oscillator settings (Lookback Period, Sensitivity, Zone Width) and your Risk Management parameters (ATR Multiplier, RR Ratio, % Risk Per Trade). These form the foundation of the strategy.
Backtest and Observe: Use TradingView's Strategy Tester to see how the core signals perform on your chosen asset and timeframe.
Layer Filters Intelligently: Enable the confirmation filters one by one and re-run your backtest. Observe how each filter impacts performance (e.g., does the T3 filter increase profitability but reduce the number of trades?). The goal is to find the optimal balance between signal quality and frequency.
Visualize and Analyze: Use the Show Risk/Reward Area option to plot your entry, stop loss, and take profit levels directly on the chart for every trade, providing a clear visual representation of your trade plan.
Disclaimer: This strategy is provided for educational and analytical purposes only. Past performance is not indicative of future results. All trading involves risk, and you should conduct your own thorough backtesting and analysis before deploying any strategy in a live market.

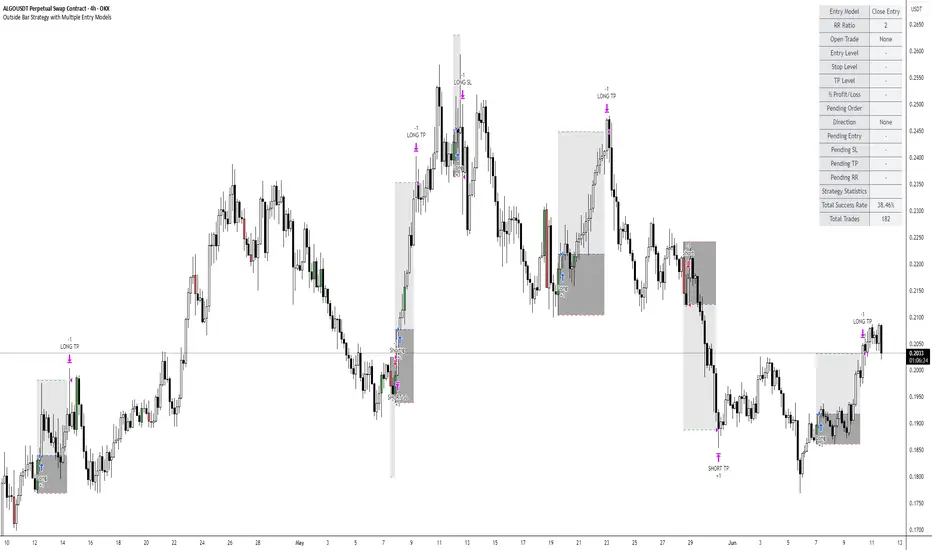
Outside Bar Strategy with Multiple Entry ModelsOutside Bar Strategy with Multiple Entry Models
This Pine Script strategy implements a versatile trading system based on the Outside Bar pattern, offering three distinct entry models: Close Entry, High/Low Entry, and Midpoint Entry. Designed for traders seeking flexibility, the strategy includes customizable risk/reward ratios, an optional EMA trend filter, and enhanced visualization with line fills.
Key Features:
Entry Models:
Close Entry: Enters a long position when the current candle closes above the high of the previous outside bullish bar . For short, it enters when the candle closes below the low of the previous outside bearish bar.
High/Low Entry: Enters a long position when the price crosses above the high of the previous outside bullish bar . For short, it enters when the price crosses below the low of the previous outside bearish bar .
Midpoint Entry: Places a limit order at the midpoint of the previous outside bar, entering when the price reaches this level.
EMA Trend Filter: Optionally filters signals based on the alignment of EMAs (7 > 25 > 99 > 200 for long, 7 < 25 < 99 < 200 for short). Can be toggled via the Use EMA Filter input.
Risk/Reward Management: Configurable risk/reward ratio (default 2.0) with stop-loss set at the low/high of the outside bar and take-profit calculated based on the bar's range multiplied by the ratio.
Visualization:
Lines for entry, stop-loss, and take-profit levels (dashed for active trades, solid for pending Midpoint Entry orders).
Line fills: Red between entry and stop-loss, green between entry and take-profit.
Previous lines and fills persist on the chart for historical reference (line deletion disabled).
Pending limit orders for Midpoint Entry extend dynamically to the right until triggered or canceled.
Information Table: Displays real-time trade details (entry model, RR ratio, open trade status, entry/stop/take-profit levels, profit/loss percentage) and strategy statistics (success rate, total trades). For Midpoint Entry, pending order details are shown.
Inputs:
Entry Model: Choose between Close Entry, High/Low Entry, or Midpoint Entry (default: Close Entry).
Risk/Reward Ratio: Set the RR ratio (default: 2.0, step: 0.5).
Use EMA Filter: Enable/disable the EMA trend filter (default: true).
Line Colors and Style: Customize colors for entry, stop-loss, and take-profit lines, and select line style (solid or dashed).
Table Settings: Adjust table text color, size (small/normal/large), and position (right top/middle/bottom).
Disclaimer: This strategy is for educational purposes only. Backtest thoroughly and use at your own risk. Past performance is not indicative of future results.
Donchian x WMA Crossover (2025 Only, Adjustable TP, Real OHLC)Short Description:
Long-only breakout system that goes long when the Donchian Low crosses up through a Weighted Moving Average, and closes when it crosses back down (with an optional take-profit), restricted to calendar year 2025. All signals use the instrument’s true OHLC data (even on Heikin-Ashi charts), start with 1 000 AUD of capital, and deploy 100 % equity per trade.
Ideal parameters configured for Temple & Webster on ASX 30 minute candles. Adjust parameter to suit however best to download candle interval data and have GPT test the pine script for optimum parameters for your trading symbol.
Detailed Description
1. Strategy Concept
This strategy captures trend-driven breakouts off the bottom of a Donchian channel. By combining the Donchian Low with a WMA filter, it aims to:
Enter when volatility compresses and price breaks above the recent Donchian Low while the longer‐term WMA confirms upward momentum.
Exit when price falls back below that same WMA (i.e. when the Donchian Low crosses back down through WMA), but only if the WMA itself has stopped rising.
Optional Take-Profit: you can specify a profit target in decimal form (e.g. 0.01 = 1 %).
2. Timeframe & Universe
In-sample period: only bars stamped between Jan 1 2025 00:00 UTC and Dec 31 2025 23:59 UTC are considered.
Any resolution (e.g. 30 m, 1 h, D, etc.) is supported—just set your preferred timeframe in the TradingView UI.
3. True-Price Execution
All indicator calculations (Donchian Low, WMA, crossover checks, take-profit) are sourced from the chart’s underlying OHLC via request.security(). This guarantees that:
You can view Heikin-Ashi or other styled candles, but your strategy will execute on the real OHLC bars.
Chart styling never suppresses or distorts your backtest results.
4. Position Sizing & Equity
Initial capital: 1 000 AUD
Size per trade: 100 % of available equity
No pyramiding: one open position at a time
5. Inputs (all exposed in the “Inputs” tab):
Input Default Description
Donchian Length 7 Number of bars to calculate the Donchian channel low
WMA Length 62 Period of the Weighted Moving Average filter
Take Profit (decimal) 0.01 Exit when price ≥ entry × (1 + take_profit_perc)
6. How It Works
Donchian Low: ta.lowest(low, DonchianLength) over the specified look-back.
WMA: ta.wma(close, WMALength) applied to true closes.
Entry: ta.crossover(DonchianLow, WMA) AND barTime ∈ 2025.
Exit:
Cross-down exit: ta.crossunder(DonchianLow, WMA) and WMA is not rising (i.e. momentum has stalled).
Take-profit exit: price ≥ entry × (1 + take_profit_perc).
Calendar exit: barTime falls outside 2025.
7. Usage Notes
After adding to your chart, open the Strategy Tester tab to review performance metrics, list of trades, equity curve, etc.
You can toggle your chart to Heikin-Ashi for visual clarity without affecting execution, thanks to the real-OHLC calls.

Kaufman Trend Strategy# ✅ Kaufman Trend Strategy – Full Description (Script Publishing Version)
**Kaufman Trend Strategy** is a dynamic trend-following strategy based on Kaufman Filter theory.
It detects real-time trend momentum, reduces noise, and aims to enhance entry accuracy while optimizing risk.
⚠️ _For educational and research purposes only. Past performance does not guarantee future results._
---
## 🎯 Strategy Objective
- Smooth price noise using Kaufman Filter smoothing
- Detect the strength and direction of trends with a normalized oscillator
- Manage profits using multi-stage take-profits and adaptive ATR stop-loss logic
---
## ✨ Key Features
- **Kaufman Filter Trend Detection**
Extracts directional signal using a state space model.
- **Multi-Stage Profit-Taking**
Automatically takes partial profits based on color changes and zero-cross events.
- **ATR-Based Volatility Stops**
Stops adjust based on swing highs/lows and current market volatility.
---
## 📊 Entry & Exit Logic
**Long Entry**
- `trend_strength ≥ 60`
- Green trend signal
- Price above the Kaufman average
**Short Entry**
- `trend_strength ≤ -60`
- Red trend signal
- Price below the Kaufman average
**Exit (Long/Short)**
- Blue trend color → TP1 (50%)
- Oscillator crosses 0 → TP2 (25%)
- Trend weakens → Final exit (25%)
- ATR + swing-based stop loss
---
## 💰 Risk Management
- Initial capital: `$3,000`
- Order size: `$100` per trade (realistic, low-risk sizing)
- Commission: `0.002%`
- Slippage: `2 ticks`
- Pyramiding: `1` max position
- Estimated risk/trade: `~0.1–0.5%` of equity
> ⚠️ _No trade risks more than 5% of equity. This strategy follows TradingView script publishing rules._
---
## ⚙️ Default Parameters
- **1st Take Profit**: 50%
- **2nd Take Profit**: 25%
- **Final Exit**: 25%
- **ATR Period**: 14
- **Swing Lookback**: 10
- **Entry Threshold**: ±60
- **Exit Threshold**: ±40
---
## 📅 Backtest Summary
- **Symbol**: USD/JPY
- **Timeframe**: 1H
- **Date Range**: Jan 3, 2022 – Jun 4, 2025
- **Trades**: 924
- **Win Rate**: 41.67%
- **Profit Factor**: 1.108
- **Net Profit**: +$1,659.29 (+54.56%)
- **Max Drawdown**: -$1,419.73 (-31.87%)
---
## ✅ Summary
This strategy uses Kaufman filtering to detect market direction with reduced lag and increased smoothness.
It’s built with visual clarity and strong trade management, making it practical for both beginners and advanced users.
---
## 📌 Disclaimer
This script is for educational and informational purposes only and should not be considered financial advice.
Use with proper risk controls and always test in a demo environment before live trading.

Grid TLong V1The “Grid TLong V1” strategy is based on the classic Grid strategy, but in the mode of buying and selling in favor of the trend and only on Long. This allows to take advantage of large uptrend movements to maximize profits in bull markets. For this reason, excessively sideways or bearish markets may not be very conducive to this strategy.
Like our Grid strategies in favor of the trend, you can enter and exit with the balance with controlled risk, as the distance between each grid functions as a natural and adaptable stop loss and take profit. What differentiates it from bidirectional strategies is that Short uses a minimum amount of follow-through, so that the percentage distance between the grids is maintained.
In this version of the script the entries and exits can be chosen at market or limit , and are based on the profit or loss of the current position, not on the percentage change in price.
The user may also notice that the strategy setup is risk-controlled, because it risks 5% on each trade, has a fairly standard commission and modest initial capital, all in order to protect the strategy user from unrealistic results.
As with all strategies, it is strongly recommended to optimize the parameters for the strategy to be effective for each asset and for each time frame.

RSI SwingRadar🧠 Strategy Overview
This long-only strategy combines RSI/MA crossovers with ATR-based risk management, designed for cleaner entries during potential bounce phases — especially tuned for assets like XMR/USDT.
🔍 Core Logic:
- RSI Crossover: Entry occurs when the 14-period RSI crosses above its 14-period SMA, signaling a potential shift in momentum.
- Oversold Filter: The RSI must have been below a user-defined oversold threshold (default: 35) on the previous candle, filtering for bounce setups after a pullback.
- ATR-Based Stop/Target: Stop-loss is placed below the low by a user-adjustable ATR multiplier (default: 0.5×). Take-profit is calculated with a Risk:Reward multiplier (default: 4×).
These elements work in tandem — RSI crossovers give momentum confirmation, oversold filtering adds context, and ATR-based exits adapt to volatility, creating a compact yet responsive strategy.
📉 Visuals:
- Dynamic Bands: The chart displays the active stop-loss, entry price, and take-profit as colored bands for easy visual tracking.
- Clean Overlay: Designed with simplicity — only confirmed setups are shown, keeping noise low.
✅ Suggested Use:
- Works best on XMR/USDT or similarly trending assets.
- Best suited for pullback entries during broader uptrends.
- Adjustable for different volatility conditions and asset behaviors.
⚠️ Disclaimer
- This strategy is for educational and research purposes only.
- It does not guarantee profitability in any market.
- Always backtest, forward-test, and understand your own risk tolerance before using any
strategy in a live environment.
- Past performance is not indicative of future results.
- This script is not financial advice.

Big Mover Catcher BTC 4h🧠 Big Mover Catcher (BTC 4H Strategy) — Educational Tool
⚠️ Disclaimer: I am not a financial advisor. This script is for educational and testing purposes only. Cryptocurrency trading is highly volatile and involves significant risk. You can lose all of your invested capital.
📌 Overview
The Big Mover Catcher strategy is a work-in-progress trading system designed for Bitcoin (BTC) on the 4-hour chart. It aims to identify strong breakout moves by combining multiple technical indicators and conditions, allowing for high customization and filter-based confirmations.
This script is part of a personal project to learn Pine Script and backtesting on TradingView. It is currently in the testing and research phase.
🎯 Strategy Objective
Catch large, high-momentum breakout moves in the BTC market using:
Bollinger Band breakouts for entry signals
Momentum, volatility, and trend filters for trade confirmation
🧰 Features & Filters
The script provides a flexible set of filters that can be turned ON/OFF and adjusted directly from the settings panel:
✅ Entry Conditions
Price must break above or below Bollinger Bands
All selected filters must align before entry
🧪 Available Filters:
Relative Strength Index (RSI) with EMA/SMA smoothing
Average Directional Index (ADX) with EMA/SMA smoothing
Average True Range (ATR) with EMA/SMA smoothing
MACD Signal above or below zero
EMA 350 trend filter
ATR / ADX / RSI Threshold toggles for added control
🔥 Additional Feature:
Force Take Profit: Optionally closes the trade immediately if a candle closes with more than a defined % movement (default: 5%). This can help lock in quick profits during high volatility moves.
⚙️ Customizable Inputs
You can configure:
Stop loss percentage
All indicator lengths
Smoothing types (EMA/SMA)
Threshold activation toggles
Individual filter ON/OFF switches
This makes the strategy highly adaptable for educational exploration and optimization.
📊 Best Used For
Learning Pine Script and strategy structure
Testing filter combinations for BTC on the 4H timeframe
Understanding how different indicators interact in live markets
⚠️ Note: ❌ Short trades are currently disabled by default, as short-side logic is still under development.
❗ Final Reminder
This script is not financial advice. It is an educational tool. Use it to learn and explore trading logic. Trading cryptocurrencies carries high risk — only invest what you can afford to lose.

EMA Pullback Speed Strategy 📌 **Overview**
The **EMA Pullback Speed Strategy** is a trend-following approach that combines **price momentum** and **Exponential Moving Averages (EMA)**.
It aims to identify high-probability entry points during brief pullbacks within ongoing uptrends or downtrends.
The strategy evaluates **speed of price movement**, **relative position to dynamic EMA**, and **candlestick patterns** to determine ideal timing for entries.
One of the key concepts is checking whether the price has **“not pulled back too much”**, helping focus only on situations where the trend is likely to continue.
⚠️ This strategy is designed for educational and research purposes only. It does not guarantee future profits.
🧭 **Purpose**
This strategy addresses the common issue of **"jumping in too late during trends and taking unnecessary losses."**
By waiting for a healthy pullback and confirming signs of **trend resumption**, traders can enter with greater confidence and reduce false entries.
🎯 **Strategy Objectives**
* Enter in the direction of the prevailing trend to increase win rate
* Filter out false signals using pullback depth, speed, and candlestick confirmations
* Predefine Take-Profit (TP) and Stop-Loss (SL) levels for safer, rule-based trading
✨ **Key Features**
* **Dynamic EMA**: Reacts faster when price moves quickly, slower when market is calm – adapting to current momentum
* **Pullback Filter**: Avoids trades when price pulls back too far (e.g., more than 5%), indicating a trend may be weakening
* **Speed Check**: Measures how strongly the price returns to the trend using candlestick body speed (open-to-close range in ticks)
📊 **Trading Rules**
**■ Long Entry Conditions:**
* Current price is above the dynamic EMA (indicating uptrend)
* Price has pulled back toward the EMA (a "buy the dip" situation)
* Pullback depth is within the threshold (not excessive)
* Candlesticks show consecutive bullish closes and break the previous high
* Price speed is strong (positive movement with momentum)
**■ Short Entry Conditions:**
* Current price is below the dynamic EMA (indicating downtrend)
* Price has pulled back up toward the EMA (a "sell the rally" setup)
* Pullback is within range (not too deep)
* Candlesticks show consecutive bearish closes and break the previous low
* Price speed is negative (downward momentum confirmed)
**■ Exit Conditions (TP/SL):**
* **Take-Profit (TP):** Fixed 1.5% target above/below entry price
* **Stop-Loss (SL):** Based on recent price volatility, calculated using ATR × 4
💰 **Risk Management Parameters**
* Symbol & Timeframe: BTCUSD on 1-hour chart (H1)
* Test Capital: \$3000 (simulated account)
* Commission: 0.02%
* Slippage: 2 ticks (minimal execution lag)
* Max risk per trade: 5% of account balance
* Backtest Period: Aug 30, 2023 – May 9, 2025
* Profit Factor (PF): 1.965 (Net profit ÷ Net loss, including spreads & fees)
⚙️ **Trading Parameters & Indicator Settings**
* Maximum EMA Length: 50
* Accelerator Multiplier: 3.0
* Pullback Threshold: 5.0%
* ATR Period: 14
* ATR Multiplier (SL distance): 4.0
* Fixed TP: 1.5%
* Short-term EMA: 21
* Long-term EMA: 50
* Long Speed Threshold: ≥ 1000.0 (ticks)
* Short Speed Threshold: ≤ -1000.0 (ticks)
⚠️Adjustments are based on BTCUSD.
⚠️Forex and other currency pairs require separate adjustments.
🔧 **Strategy Improvements & Uniqueness**
Unlike basic moving average crossovers or RSI triggers, this strategy emphasizes **"momentum-supported pullbacks"**.
By combining dynamic EMA, speed checks, and candlestick signals, it captures trades **as if surfing the wave of a trend.**
Its built-in filters help **avoid overextended pullbacks**, which often signal the trend is ending – making it more robust than traditional trend-following systems.
✅ **Summary**
The **EMA Pullback Speed Strategy** is easy to understand, rule-based, and highly reproducible – ideal for both beginners and intermediate traders.
Because it shows **clear visual entry/exit points** on the chart, it’s also a great tool for practicing discretionary trading decisions.
⚠️ Past performance is not a guarantee of future results.
Always respect your Stop-Loss levels and manage your position size according to your risk tolerance.

Multi-Indicator Swing [TIAMATCRYPTO]v6# Strategy Description:
## Multi-Indicator Swing
This strategy is designed for swing trading across various markets by combining multiple technical indicators to identify high-probability trading opportunities. The system focuses on trend strength confirmation and volume analysis to generate precise entry and exit signals.
### Core Components:
- **Supertrend Indicator**: Acts as the primary trend direction filter with optimized settings (Factor: 3.0, ATR Period: 10) to balance responsiveness and reliability.
- **ADX (Average Directional Index)**: Confirms the strength of the prevailing trend, filtering out sideways or choppy market conditions where the strategy avoids taking positions.
- **Liquidity Delta**: A volume-based indicator that analyzes buying and selling pressure imbalances to validate trend direction and potential reversals.
- **PSAR (Optional)**: Can be enabled to add additional confirmation for trend changes, turned off by default to reduce signal filtering.
### Key Features:
- **Flexible Direction Trading**: Choose between long-only, short-only, or bidirectional trading to adapt to market conditions or account restrictions.
- **Conservative Risk Management**: Implements fixed percentage-based stop losses (default 2%) and take profits (default 4%) for a positive risk-reward ratio.
- **Realistic Backtesting Parameters**: Includes commission (0.1%) and slippage (2 points) to reflect real-world trading conditions.
- **Visual Signals**: Clear buy/sell arrows with customizable sizes for easy identification on the chart.
- **Information Panel**: Dynamic display showing active indicators and current risk settings.
### Best Used On:
Daily timeframes for cryptocurrencies, forex, or stock indices. The strategy performs optimally on assets with clear trending behavior and sufficient volatility.
### Default Settings:
Optimized for conservative position sizing (5% of equity per trade) with an initial capital of $10,000. The backtesting period (2021-2023) provides a statistically significant sample of varied market conditions.

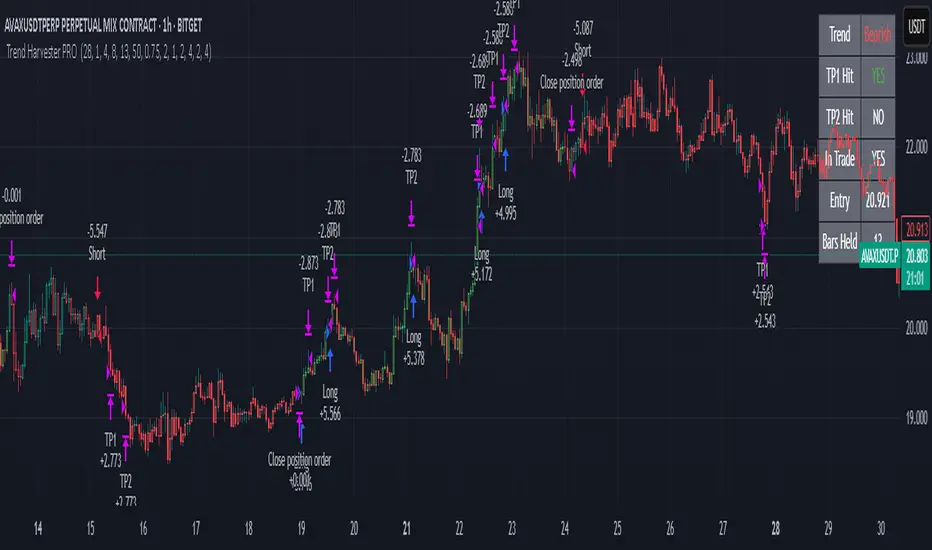
Trend Harvester PRO Trend Harvester PRO – Adaptive Trend-Following Strategy for Crypto
Trend Harvester PRO is a fully systematic trend-following strategy built for cryptocurrency markets on intraday timeframes — particularly optimized for the 1-hour chart. The script combines ZLEMA-based trend tracking, momentum confirmation, and a volatility-aware filter to detect high-probability directional moves with clarity and precision.
This is not a mashup of random indicators — each component serves a specific purpose in validating trends, avoiding choppy zones, and timing entries responsibly.
🔍 Strategy Logic Overview
The core objective is to detect sustainable, real-time trends and exit with multi-stage profit targets. To do this, the script uses several layers of confirmation:
1. 📊 ZLEMA Trend Engine (Zero Lag EMA)
This is the backbone of the strategy.
ZLEMA (Zero-Lag EMA) is a moving average that minimizes lag by adjusting for past data offset.
The strategy uses a fast ZLEMA and a slow ZLEMA, combined with a slope calculation, to assess the current trend.
When:
Fast ZLEMA > Slow ZLEMA
The ZLEMA is rising (positive slope)
→ The market is considered in an uptrend.
Conversely, if:
Fast ZLEMA < Slow ZLEMA
The slope is negative
→ The market is considered in a downtrend.
This setup detects not just direction, but also whether the trend has meaningful acceleration.
2. ⚡ Momentum Confirmation
Trend direction alone isn’t enough — we also need momentum agreement.
The script calculates a smoothed Rate of Change (ROC) to evaluate if momentum supports the direction of the ZLEMA trend.
For long trades: ROC must be positive
For short trades: ROC must be negative
This prevents taking trades where price is crossing moving averages but lacks follow-through power.
3. 🌪️ Volatility Filter
Choppy markets are common in crypto. To reduce false signals:
The script compares short-term volatility (10-bar standard deviation of price changes) to longer-term volatility.
If the ratio is too high (i.e., short-term volatility is spiking), the strategy avoids entry.
This ensures trades are only taken when the market is relatively calm and directional — avoiding false breakouts.
4. 🧠 Confirmation Bars + Trend State
Signals only trigger after a certain number of consecutive bars confirm trend direction (confirmBars).
This prevents reacting to just 1 candle and requires consistent evidence of trend.
A state machine is used to track current trend status:
+1 = confirmed uptrend
-1 = confirmed downtrend
0 = neutral / no trade
This trend state changes only after all conditions are met and confirmation bars pass.
5. 🧊 Cooldown Enforcement
After a trade exits (from TP or a trend reversal), the strategy enforces a cooldown period before new entries are allowed. This:
Prevents back-to-back entries on trend flips
Reduces overtrading
Helps avoid whipsaws or same-bar reversal trades
6. 🎯 Multi-Level Take Profits (TP1 & TP2)
Once a trade is entered:
Two limit exits are set automatically:
TP1: Closes 50% of the position at a configurable profit level
TP2: Closes the remaining 50%
If the trend weakens before TP2 is reached, the position is closed early.
Both long and short trades use the same logic, with user-defined percentages.
This system allows for partial profit-taking while keeping a portion of the trade running.
7. 🧾 Built-in Dashboard
The script includes a real-time dashboard showing:
Trend direction: Bullish, Bearish, or Neutral
Whether TP1 / TP2 was hit
Entry price
If currently in a trade
How many bars the trade has been open
This helps monitor strategy performance at a glance without needing extra labels.
8. 🔔 Webhook-Compatible Alerts
The strategy includes custom alerts that can be used for:
Long and Short entries
TP1 and TP2 hits
Exiting trades
These can be integrated into automated bot systems or used manually.
🔒 Non-Repainting Logic
The strategy uses only confirmed bar data (i.e., values from closed bars).
There are no repainting indicators.
Entries and exits are placed using strategy.entry and strategy.exit on confirmed conditions.
✅ How to Use It
Apply the strategy to 1H altcoin charts (BTC, ETH, SOL, etc.).
Tune the TP percentages (longTP1Pct, longTP2Pct, etc.) based on volatility.
Use the dashboard to monitor trend state and trade progress.
Combine with additional tools (like support/resistance or volume) for higher confluence.
Use the date filter to run backtests over defined periods.
⚠️ Risk Management Notice
This strategy does not include stop losses by default. It is designed to exit based on trend reversal or take-profit limits.
Always backtest thoroughly and use realistic sizing.
Do not risk more than 5–10% of your account on any trade.
Past results do not guarantee future performance. This tool is for educational and research purposes.
🧬 What Makes This Original
Trend Harvester PRO was built from scratch with tightly integrated logic:
ZLEMA tracks early trend direction with low lag
ROC confirms momentum in the same direction
Volatility filter avoids false setups
Multi-bar confirmation and cooldown logic control trade pacing
Dual TP exits manage partial profit-taking
A live dashboard makes real-time tracking intuitive
Unlike mashups of indicators with no synergy, each component here directly supports the quality of trade decisions, and the logic is modular, transparent, and non-repainting.
Liquid Pulse Liquid Pulse by Dskyz (DAFE) Trading Systems
Liquid Pulse is a trading algo built by Dskyz (DAFE) Trading Systems for futures markets like NQ1!, designed to snag high-probability trades with tight risk control. it fuses a confluence system—VWAP, MACD, ADX, volume, and liquidity sweeps—with a trade scoring setup, daily limits, and VIX pauses to dodge wild volatility. visuals include simple signals, VWAP bands, and a dashboard with stats.
Core Components for Liquid Pulse
Volume Sensitivity (volumeSensitivity) controls how much volume spikes matter for entries. options: 'Low', 'Medium', 'High' default: 'High' (catches small spikes, good for active markets) tweak it: 'Low' for calm markets, 'High' for chaos.
MACD Speed (macdSpeed) sets the MACD’s pace for momentum. options: 'Fast', 'Medium', 'Slow' default: 'Medium' (solid balance) tweak it: 'Fast' for scalping, 'Slow' for swings.
Daily Trade Limit (dailyTradeLimit) caps trades per day to keep risk in check. range: 1 to 30 default: 20 tweak it: 5-10 for safety, 20-30 for action.
Number of Contracts (numContracts) sets position size. range: 1 to 20 default: 4 tweak it: up for big accounts, down for small.
VIX Pause Level (vixPauseLevel) stops trading if VIX gets too hot. range: 10 to 80 default: 39.0 tweak it: 30 to avoid volatility, 50 to ride it.
Min Confluence Conditions (minConditions) sets how many signals must align. range: 1 to 5 default: 2 tweak it: 3-4 for strict, 1-2 for more trades.
Min Trade Score (Longs/Shorts) (minTradeScoreLongs/minTradeScoreShorts) filters trade quality. longs range: 0 to 100 default: 73 shorts range: 0 to 100 default: 75 tweak it: 80-90 for quality, 60-70 for volume.
Liquidity Sweep Strength (sweepStrength) gauges breakouts. range: 0.1 to 1.0 default: 0.5 tweak it: 0.7-1.0 for strong moves, 0.3-0.5 for small.
ADX Trend Threshold (adxTrendThreshold) confirms trends. range: 10 to 100 default: 41 tweak it: 40-50 for trends, 30-35 for weak ones.
ADX Chop Threshold (adxChopThreshold) avoids chop. range: 5 to 50 default: 20 tweak it: 15-20 to dodge chop, 25-30 to loosen.
VWAP Timeframe (vwapTimeframe) sets VWAP period. options: '15', '30', '60', '240', 'D' default: '60' (1-hour) tweak it: 60 for day, 240 for swing, D for long.
Take Profit Ticks (Longs/Shorts) (takeProfitTicksLongs/takeProfitTicksShorts) sets profit targets. longs range: 5 to 100 default: 25.0 shorts range: 5 to 100 default: 20.0 tweak it: 30-50 for trends, 10-20 for chop.
Max Profit Ticks (maxProfitTicks) caps max gain. range: 10 to 200 default: 60.0 tweak it: 80-100 for big moves, 40-60 for tight.
Min Profit Ticks to Trail (minProfitTicksTrail) triggers trailing. range: 1 to 50 default: 7.0 tweak it: 10-15 for big gains, 5-7 for quick locks.
Trailing Stop Ticks (trailTicks) sets trail distance. range: 1 to 50 default: 5.0 tweak it: 8-10 for room, 3-5 for fast locks.
Trailing Offset Ticks (trailOffsetTicks) sets trail offset. range: 1 to 20 default: 2.0 tweak it: 1-2 for tight, 5-10 for loose.
ATR Period (atrPeriod) measures volatility. range: 5 to 50 default: 9 tweak it: 14-20 for smooth, 5-9 for reactive.
Hardcoded Settings volLookback: 30 ('Low'), 20 ('Medium'), 11 ('High') volThreshold: 1.5 ('Low'), 1.8 ('Medium'), 2 ('High') swingLen: 5
Execution Logic Overview trades trigger when confluence conditions align, entering long or short with set position sizes. exits use dynamic take-profits, trailing stops after a profit threshold, hard stops via ATR, and a time stop after 100 bars.
Features Multi-Signal Confluence: needs VWAP, MACD, volume, sweeps, and ADX to line up.
Risk Control: ATR-based stops (capped 15 ticks), take-profits (scaled by volatility), and trails.
Market Filters: VIX pause, ADX trend/chop checks, volatility gates. Dashboard: shows scores, VIX, ADX, P/L, win %, streak.
Visuals Simple signals (green up triangles for longs, red down for shorts) and VWAP bands with glow. info table (bottom right) with MACD momentum. dashboard (top right) with stats.
Chart and Backtest:
NQ1! futures, 5-minute chart. works best in trending, volatile conditions. tweak inputs for other markets—test thoroughly.
Backtesting: NQ1! Frame: Jan 19, 2025, 09:00 — May 02, 2025, 16:00 Slippage: 3 Commission: $4.60
Fee Typical Range (per side, per contract)
CME Exchange $1.14 – $1.20
Clearing $0.10 – $0.30
NFA Regulatory $0.02
Firm/Broker Commis. $0.25 – $0.80 (retail prop)
TOTAL $1.60 – $2.30 per side
Round Turn: (enter+exit) = $3.20 – $4.60 per contract
Disclaimer this is for education only. past results don’t predict future wins. trading’s risky—only use money you can lose. backtest and validate before going live. (expect moderators to nitpick some random chart symbol rule—i’ll fix and repost if they pull it.)
About the Author Dskyz (DAFE) Trading Systems crafts killer trading algos. Liquid Pulse is pure research and grit, built for smart, bold trading. Use it with discipline. Use it with clarity. Trade smarter. I’ll keep dropping badass strategies ‘til i build a brand or someone signs me up.
2025 Created by Dskyz, powered by DAFE Trading Systems. Trade smart, trade bold.

Reverse Keltner Channel StrategyReverse Keltner Channel Strategy
Overview
The Reverse Keltner Channel Strategy is a mean-reversion trading system that capitalizes on price movements between Keltner Channels. Unlike traditional Keltner Channel strategies that trade breakouts, this system takes the contrarian approach by entering positions when price returns to the channel after overextending.
Strategy Logic
Long Entry Conditions:
Price crosses above the lower Keltner Channel from below
This signals a potential reversal after an oversold condition
Position is entered at market price upon signal confirmation
Long Exit Conditions:
Take Profit: Price reaches the upper Keltner Channel
Stop Loss: Placed at half the channel width below entry price
Short Entry Conditions:
Price crosses below the upper Keltner Channel from above
This signals a potential reversal after an overbought condition
Position is entered at market price upon signal confirmation
Short Exit Conditions:
Take Profit: Price reaches the lower Keltner Channel
Stop Loss: Placed at half the channel width above entry price
Key Features
Mean Reversion Approach: Takes advantage of price tendency to return to mean after extreme moves
Adaptive Stop Loss: Stop loss dynamically adjusts based on market volatility via ATR
Visual Signals: Entry points clearly marked with directional triangles
Fully Customizable: All parameters can be adjusted to fit various market conditions
Customizable Parameters
Keltner EMA Length: Controls the responsiveness of the channel (default: 20)
ATR Multiplier: Determines channel width/sensitivity (default: 2.0)
ATR Length: Affects volatility calculation period (default: 10)
Stop Loss Factor: Adjusts risk management aggressiveness (default: 0.5)
Best Used On
This strategy performs well on:
Currency pairs with defined ranging behavior
Commodities that show cyclical price movements
Higher timeframes (4H, Daily) for more reliable signals
Markets with moderate volatility
Risk Management
The built-in stop loss mechanism automatically adjusts to market conditions by calculating position risk relative to the current channel width. This approach ensures that risk remains proportional to potential reward across varying market conditions.
Notes for Optimization
Consider adjusting the EMA length and ATR multiplier based on the specific asset and timeframe:
Lower values increase sensitivity and generate more signals
Higher values produce fewer but potentially more reliable signals
As with any trading strategy, thorough backtesting is recommended before live implementation.
Past performance is not indicative of future results. Always practice sound risk management.

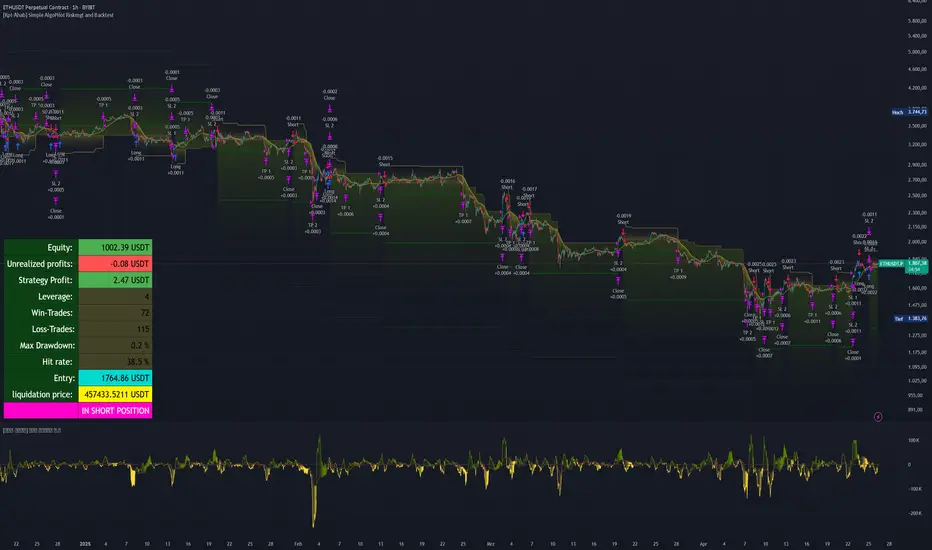
[Kpt-Ahab] Simple AlgoPilot Riskmgt and Backtest Simple AlgoPilot Riskmgt and Backtest
This script provides a compact solution for automated risk management and backtesting within TradingView.
It offers the following core functionalities:
Risk Management:
The system integrates various risk limitation mechanisms:
Percentage-based or trailing stop-loss
Maximum losing streak limitation
Maximum drawdown limitation relative to account equity
Flexible position sizing control (based on equity, fixed size, or contracts)
Dynamic repurchasing of positions ("Repurchase") during losses with adjustable size scaling
Supports multi-stage take-profit targets (TP1/TP2) and automatic stop-loss adjustment to breakeven
External Signal Processing for Backtesting:
In addition to its own moving average crossovers, the script can process external trading signals:
External signals are received via a source input variable (e.g., from other indicators or signal generators)
Positive values (+1) trigger long positions, negative values (–1) trigger short positions
This allows for easy integration of other indicator-based strategies into backtests
Additional Backtesting Features:
Selection between different MA types (SMA, EMA, WMA, VWMA, HMA)
Flexible time filtering (trade only within defined start and end dates)
Simulation of commission costs, slippage, and leverage
Optional alert functions for moving average crossovers
Visualization of liquidation prices and portfolio development in an integrated table
Note: This script is primarily intended for strategic backtesting and risk setting optimization.
Real-time applications should be tested with caution. All order executions, alerts, and risk calculations are purely simulation-based.
Explanation of Calculations and Logics:
1. Risk Management and Position Sizing:
The position size is calculated based on the user’s choice using three possible methods:
Percentage of Equity:
The position size is a defined fraction of the available capital, dynamically adjusted based on market price (riskPerc / close).
Fixed Size (in currency): The user defines a fixed monetary amount to be used per trade.
Contracts: A fixed number of contracts is traded regardless of the current price.
Leverage: The selected leverage multiplies the position size for margin calculations.
2. Trade Logic and Signal Triggering:
Trades can be triggered through two mechanisms:
Internal Signals:
When a fast moving average crosses above or below a slower moving average (ta.crossover, ta.crossunder). The type of moving averages (SMA, EMA, WMA, VWMA, HMA) can be freely selected.
External Signals:
Signals from other indicators can be received via an input source field.
+1 triggers a long entry, –1 triggers a short entry.
Position Management:
Once entered, the position is actively managed.
Multiple take-profit targets are set.
Upon reaching a profit target, the stop-loss can optionally be moved to breakeven.
3. Stop-Loss and Take-Profit Logic:
Stop-Loss Types:
Fixed Percentage Stop:
A fixed distance below/above the entry price.
Trailing Stop:
Dynamically adjusts as the trade moves into profit.
Fast Trailing Stop:
A more aggressive variant of trailing that reacts quicker to price changes.
Take-Profit Management:
Two take-profit targets (TP1 and TP2) are supported, allowing partial exits at different stages.
Remaining positions can either reach the second target or be closed by the stop-loss.
4. Repurchase Strategy ("Scaling In" on Losses):
If a position reaches a specified loss threshold (e.g., –15%), an automatic additional purchase can occur.
The position size is increased by a configurable percentage.
Repurchases happen only if an initial position is already open.
5. Backtesting Control and Filters:
Time Filters:
A trading period can be defined (start and end date).
All trades outside the selected period are ignored.
Risk Filters: Trading is paused if:
A maximum losing streak is reached.
A maximum allowed drawdown is exceeded.
6. Liquidation Calculation (Simulation Only):
The script simulates liquidation prices based on the account balance and position size.
Liquidation lines are drawn on the chart to better visualize potential risk exposure.
This is purely a visual aid — no real broker-side liquidation is performed.
DCA OptimizedMonthly or Daily DCA strategy, with adjustable capital allocation percentages at the beginning of each quarter (January, April, July, and October) as well as for the other months of the year. Capital allocation settings are also customizable for daily DCA.
The strategy consists of performing annual DCA, taking profits at the end of the year, specifically on December 31st of each year, and repeating the process the following year.
If the year ends with an unrealized loss on the total invested, hold the assets until December 31st, until the asset is in profit.
Purchases are made on the first day of each month, at the daily opening price. The same applies to monthly or daily DCA (daily opening price).
By default, it is recommended to invest twice as much at the beginning of each quarter (January/April/July/October) compared to other months of the year. This allows you to optimize the average acquisition price over the long term, thus maximizing profits and reducing potential unrealized losses.
Example: January/April/July/October > 12.5% of the capital / Other months of the year > 6.25% of the capital (Total over 12 months = 100%)
You can select/unselect the months of the year in which to invest as you wish to optimize your periodic preferences.

AccumulationPro Money Flow StrategyAccumulationPro Money Flow Strategy identifies stock trading opportunities by analyzing money flow and potential long-only opportunities following periods of increased money inflow. It employs proprietary responsive indicators and oscillators to gauge the strength and momentum of the inflow relative to previous periods, detecting money inflow, buying/selling pressure, and potential continuation/reversals, while using trailing stop exits to maximize gains while minimizing losses, with careful consideration of risk management and position sizing.
Setup Instructions:
1. Configuring the Strategy Properties:
Click the "Settings" icon (the gear symbol) next to the strategy name.
Navigate to the "Properties" tab within the Settings window.
Initial Capital: This value sets the starting equity for the strategy backtesting. Keep in mind that you will need to specify your current account size in the "Inputs" settings for position sizing.
Base Currency: Leave this setting at its "Default" value.
Order Size: This setting, which determines the capital used for each trade during backtesting, is automatically calculated and updated by the script. You should leave it set to "1 Contract" and the script will calculate the appropriate number of contracts based on your risk per trade, account size, and stop-loss placement.
Pyramiding: Set this setting at 1 order to prevent the strategy from adding to existing positions.
Commission: Enter your broker's commission fee per trade as a percentage, some brokers might offer commission free trading. Verify Price for limit orders: Keep this value as 0 ticks.
Slippage: This value depends on the instrument you are trading, If you are trading liquid stocks on a 1D chart slippage might be neglected. You can Keep this value as 1 ticks if you want to be conservative.
Margin for long positions/short positions: Set both of these to 100% since this strategy does not employ leverage or margin trading.
Recalculate:
Select the "After order is filled" option.
Select the "On every tick" option.
Fill Orders: Keep “Using bar magnifier” unselected.
Select "On bar close". Select "Using standard OHLC"
2. Configuring the Strategy Inputs:
Click the "Inputs" tab in the Settings window.
From/Thru (Date Range): To effectively backtest the strategy, define a substantial period that includes various bullish and bearish cycles. This ensures the testing window captures a range of market conditions and provides an adequate number of trades. It is usually favorable to use a minimum of 8 years for backtesting. Ensure the "Show Date Range" box is checked.
Account Size: This is your actual current Account Size used in the position sizing table calculations.
Risk on Capital %: This setting allows you to specify the percentage of your capital you are willing to risk on each trade. A common value is 0.5%.
3. Configuring Strategy Style:
Select the "Style" tab.
Select the checkbox for “Stop Loss” and “Stop Loss Final” to display the black/red Average True Range Stop Loss step-lines
Make sure the checkboxes for "Upper Channel", "Middle Line", and "Lower Channel" are selected.
Select the "Plots Background" checkboxes for "Color 0" and "Color 1" so that the potential entry and exit zones become color-coded.
Having the checkbox for "Tables" selected allows you to see position sizing and other useful information within the chart.
Have the checkboxes for "Trades on chart" and "Signal Labels" selected for viewing entry and exit point labels and positions.
Uncheck* the "Quantity" checkbox.
Precision: select “Default”.
Check “Labels on price scale”
Check “Values in status line”
Strategy Application Guidelines:
Entry Conditions:
The strategy identifies long entry opportunities based on substantial money inflow, as detected by our proprietary indicators and oscillators. This assessment considers the strength and momentum of the inflow relative to previous periods, in conjunction with strong price momentum (indicated by our modified, less-lagging MACD) and/or a potential price reversal (indicated by our modified, less-noisy Stochastic). Additional confirmation criteria related to price action are also incorporated. Potential entry and exit zones are visually represented by bands on the chart.
A blue upward-pointing arrow, accompanied by the label 'Long' and green band fills, signifies a long entry opportunity. Conversely, a magenta downward-pointing arrow, labeled 'Close entry(s) order Long' with yellow band fills, indicates a potential exit.
Take Profit:
The strategy employs trailing stops, rather than fixed take-profit levels, to maximize gains while minimizing losses. Trailing stops adjust the stop-loss level as the stock price moves in a favorable direction. The strategy utilizes two types of trailing stop mechanisms: one based on the Average True Range (ATR), and another based on price action, which attempts to identify shifts in price momentum.
Stop Loss:
The strategy uses an Average True Range (ATR)-based stop-loss, represented by two lines on the chart. The black line indicates the primary ATR-based stop-loss level, set upon trade entry. The red line represents a secondary ATR stop-loss buffer, used in the position sizing calculation to account for potential slippage or price gaps.
To potentially reduce the risk of stop-hunting, discretionary traders might consider using a market sell order within the final 30 to 60 minutes of the main session, instead of automated stop-loss orders.
Order Types:
Market Orders are intended for use with this strategy, specifically when the candle and signal on the chart stabilize within the final 30 to 60 minutes of the main trading session.
Position Sizing:
A key aspect of this strategy is that its position size is calculated and displayed in a table on the chart. The position size is calculated based on stop-loss placement, including the stop-loss buffer, and the capital at risk per trade which is commonly set around 0.5% Risk on Capital per Trade.
Backtesting:
The backtesting results presented below the chart are for informational purposes only and are not intended to predict future performance. Instead, they serve as a tool for identifying instruments with which the strategy has historically performed well.
It's important to note that the backtester utilizes a tiny portion of the capital for each trade while our strategy relies on a diversified portfolio of multiple stocks or instruments being traded at once.
Important Considerations:
Volume data is crucial; the strategy will not load or function correctly without it. Ensure that your charts include volume data, preferably from a centralized exchange.
Our system is designed for trading a portfolio. Therefore, if you intend to use our system, you should employ appropriate position sizing, without leverage or margin, and seek out a variety of long opportunities, rather than opening a single trade with an excessively large position size.
If you are trading without automated signals, always allow the chart to stabilize. Refrain from taking action until the final 1 hour to 30 minutes before the end of the main trading session to minimize the risk of acting on false signals.
To align with the strategy's design, it's generally preferable to enter a trade during the same session that the signal appears, rather than waiting for a later session.
Disclaimer:
Trading in financial markets involves a substantial degree of risk. You should be aware of the potential for significant financial losses. It is imperative that you trade responsibly and avoid overtrading, as this can amplify losses. Remember that market conditions can change rapidly, and past performance is not indicative of future results. You could lose some or all of your initial investment. It is strongly recommended that you fully understand the risks involved in trading and seek independent financial advice from a qualified professional before using this strategy.

Supertrend Hombrok BotSupertrend Hombrok Bot – Automated Trading Strategy for Dynamic Market Conditions
This trading strategy script has been developed to operate automatically based on detailed market conditions. It combines the popular Supertrend indicator, RSI (Relative Strength Index), Volume, and ATR (Average True Range) to determine the best entry and exit points while maintaining proper risk management.
Key Features:
Supertrend as the Base: Uses the Supertrend indicator to identify the market's trend direction, generating buy signals when the market is in an uptrend and sell signals when in a downtrend.
RSI Filter: The RSI is used to determine overbought and oversold conditions, helping to avoid entries in extreme market conditions. Entries are avoided when RSI > 70 (overbought) and RSI < 30 (oversold), reducing the risk of false movements.
Volume Filter: The strategy checks if the trading volume is above the average multiplied by a user-defined factor. This ensures that only significant movements, with higher liquidity, are considered.
Candle Body Size: The strategy filters only candles with a body large enough relative to the ATR (Average True Range), ensuring that the price movements on the chart have sufficient strength.
Risk Management: The bot is configured to operate with an adjustable Risk/Reward Ratio (R:R). This means that for each trade, both Take Profit (TP) and Stop Loss (SL) are adjusted based on the market's volatility as measured by the ATR.
Automatic Entries and Exits: The script automatically executes entries based on the specified conditions and exits with predefined Stop Loss and Take Profit levels, ensuring risk is controlled for each trade.
How It Works:
Buy Condition: Triggered when the market is in an uptrend (Supertrend), the volume is above the adjusted average, the candle body is strong enough, and the RSI is below the overbought level.
Sell Condition: Triggered when the market is in a downtrend (Supertrend), the volume is above the adjusted average, the candle body is strong enough, and the RSI is above the oversold level.
Alerts:
Buy and Sell Alerts are configured with detailed information, including Stop Loss and Take Profit values, allowing the user to receive notifications when trading conditions are met.
Capital Management:
The capital per trade can be adjusted based on account size and risk profile.
Important Note:
Always test before trading with real capital: While the strategy has been designed based on solid technical analysis methods, always perform tests in real-time market conditions with demo accounts before applying the bot in live trading.
Disclaimer: This script is a tool to assist in the trading process and does not guarantee profit. Past performance is not indicative of future results, and the trader is always responsible for their investment decisions.

Moving Average Shift WaveTrend StrategyMoving Average Shift WaveTrend Strategy
🧭 Overview
The Moving Average Shift WaveTrend Strategy is a trend-following and momentum-based trading system designed to be overlayed on TradingView charts. It executes trades based on the confluence of multiple technical conditions—volatility, session timing, trend direction, and oscillator momentum—to deliver logical and systematic trade entries and exits.
🎯 Strategy Objectives
Enter trades aligned with the prevailing long-term trend
Exit trades on confirmed momentum reversals
Avoid false signals using session timing and volatility filters
Apply structured risk management with automatic TP, SL, and trailing stops
⚙️ Key Features
Selectable MA types: SMA, EMA, SMMA (RMA), WMA, VWMA
Dual-filter logic using a custom oscillator and moving averages
Session and volatility filters to eliminate low-quality setups
Trailing stop, configurable Take Profit / Stop Loss logic
“In-wave flag” prevents overtrading within the same trend wave
Visual clarity with color-shifting candles and entry/exit markers
📈 Trading Rules
✅ Long Entry Conditions:
Price is above the selected MA
Oscillator is positive and rising
200-period EMA indicates an uptrend
ATR exceeds its median value (sufficient volatility)
Entry occurs between 09:00–17:00 (exchange time)
Not currently in an active wave
🔻 Short Entry Conditions:
Price is below the selected MA
Oscillator is negative and falling
200-period EMA indicates a downtrend
All other long-entry conditions are inverted
❌ Exit Conditions:
Take Profit or Stop Loss is hit
Opposing signals from oscillator and MA
Trailing stop is triggered
🛡️ Risk Management Parameters
Pair: ETH/USD
Timeframe: 4H
Starting Capital: $3,000
Commission: 0.02%
Slippage: 2 pips
Risk per Trade: 2% of account equity (adjustable)
Total Trades: 224
Backtest Period: May 24, 2016 — April 7, 2025
Note: Risk parameters are fully customizable to suit your trading style and broker conditions.
🔧 Trading Parameters & Filters
Time Filter: Trades allowed only between 09:00–17:00 (exchange time)
Volatility Filter: ATR must be above its median value
Trend Filter: Long-term 200-period EMA
📊 Technical Settings
Moving Average
Type: SMA
Length: 40
Source: hl2
Oscillator
Length: 15
Threshold: 0.5
Risk Management
Take Profit: 1.5%
Stop Loss: 1.0%
Trailing Stop: 1.0%
👁️ Visual Support
MA and oscillator color changes indicate directional bias
Clear chart markers show entry and exit points
Trailing stops and risk controls are transparently managed
🚀 Strategy Improvements & Uniqueness
In-wave flag avoids repeated entries within the same trend phase
Filtering based on time, volatility, and trend ensures higher-quality trades
Dynamic high/low tracking allows precise trailing stop placement
Fully rule-based execution reduces emotional decision-making
💡 Inspirations & Attribution
This strategy is inspired by the excellent concept from:
ChartPrime – “Moving Average Shift”
It expands on the original idea with advanced trade filters and trailing logic.
Source reference:
📌 Summary
The Moving Average Shift WaveTrend Strategy offers a rule-based, reliable approach to trend trading. By combining trend and momentum filters with robust risk controls, it provides a consistent framework suitable for various market conditions and trading styles.
⚠️ Disclaimer
This script is for educational purposes only. Trading involves risk. Always use proper backtesting and risk evaluation before applying in live markets.

Gradient Sniper Elite🧠 Gradient Sniper Elite — Precision Trend Detection and Tactical Trade Execution for Crypto
Gradient Sniper Elite is a high-performance crypto trend strategy engineered for accuracy, adaptability, and smart execution on the 1-hour timeframe. This script is not just a mashup — it's a purpose-built system that combines trend, momentum, and volume filters in a structured and non-repainting framework designed for optimal entry and exit timing.
🔍 What Makes It Original?
This strategy combines several proven concepts into a unified, precision-calibrated trade engine:
✅ ZLEMA Gradient Filter: A slope-based trend filter that captures the direction and strength of momentum shifts without repainting.
✅ TEMA Confirmation: Triple EMA logic confirms trend acceleration or exhaustion by analyzing layered EMA cross-smoothing.
✅ RMI-Based Trend Direction: Replaces traditional RSI with a Relative Momentum Index (RMI), which smooths price momentum and avoids lag.
✅ ROC & Smoothed CCI: Dual momentum filters ensure that trades align with both velocity and structure of price moves.
✅ Volume Spike Filter: Filters out false breakouts and manipulation by confirming entries only during statistically significant volume surges.
✅ TP1/TP2 Split Take Profit Logic: 50% partial exit at TP1 and full exit at TP2. Ensures flexible profit-taking while maximizing trend continuation gains.
✅ Trend Weakness Exit: Trades are exited cleanly when the trend begins to weaken (as confirmed by RMI flip), preventing overstay and drawdown.
✅ 1-Bar Reversal Delay: The system enforces a 1-bar delay between a trade closure and any potential reversal entry, ensuring clean trend reversals and realistic live trading behavior.
✅ No Stop Loss: This strategy does not use a stop loss. Instead, it exits trades based on trend weakness or TP2 being hit. This avoids premature exits in volatile crypto environments, while maintaining controlled and dynamic trade management logic.
⚙️ How It Works
This strategy uses multi-layered confirmation:
Trend Structure
ZLEMA Gradient: Captures the slope of price action.
White Line + Fast/Slow Tether Lines: Define macro trend structure and act as dynamic S/R filters.
Momentum Alignment
Rate of Change (ROC): Measures directional velocity.
Smoothed CCI: Refines entry timing within the trend.
TEMA: Adds second-layer trend confirmation.
Volume Confirmation
Entry signals are validated by detecting relative volume spikes compared to a moving average baseline, avoiding entries on low-volume or fake breakouts.
Trade Management
Dynamic take-profits (TP1/TP2).
Immediate exit on trend weakening.
No same-bar entry/exit — reversal entries are delayed until after full exit confirmation.
No stop loss — trade management is handled via trend logic and take profit levels.
📊 Dashboard Overview
Gradient Sniper Elite includes a built-in dashboard in the top-right corner of the chart. It dynamically updates on each bar and shows:
📍 Position: Displays "Long", "Short", or "Flat" depending on the active trade
💰 Entry Price: The exact price where the trade was entered
📈 Unrealized %: Current profit/loss as a percentage
💵 Unrealized $: Estimated PnL in dollars, scaled to your backtest capital
📊 Trades / Win Rate: Live counter for total trades, win/loss count, and win rate
🎯 TP1 Hit / TP2 Hit: Shows ✅ or ❌ depending on whether each target level was reached during the current trade
This dashboard helps you monitor trade status, track live performance, and validate signal behavior in real time — all without repainting or relying on external tools.
📈 How to Use
Timeframe: Optimized for the 1-hour timeframe, but adaptable.
Asset Class: Primarily built for crypto markets, especially fast-moving alts like AVAX, LINK, QNT, etc.
Trade Mode: Supports long and short trades with clean reversal logic.
Dashboard: Live stats including position status, TP1/TP2 hit, win rate, and real-time PnL tracking.
Backtest Ready: Built with full compliance to TradingView backtest engine — results are realistic and match live-bar behavior.
⚠️ No Repainting — No Guesswork
Every element in this script is designed to work with confirmed bar data only. There is zero forward-looking logic. This makes Gradient Sniper Elite fully compatible with both backtesting and live algo execution.
🧩 Why This Isn’t Just a Mashup
Each indicator in this strategy has a specific role:
ZLEMA: Core trend slope engine.
TEMA: Trend reinforcement.
RMI: Directional decision layer.
CCI & ROC: Entry timing refinement.
Volume Filter: Risk filtering.
They’re not merged randomly, but combined in sequence to eliminate noise and optimize entries.
📌 Disclaimer
This script is for informational and educational purposes only. It does not constitute financial advice or a recommendation to buy or sell any asset. Always do your own research and use appropriate risk management when trading. Past performance does not guarantee future results.
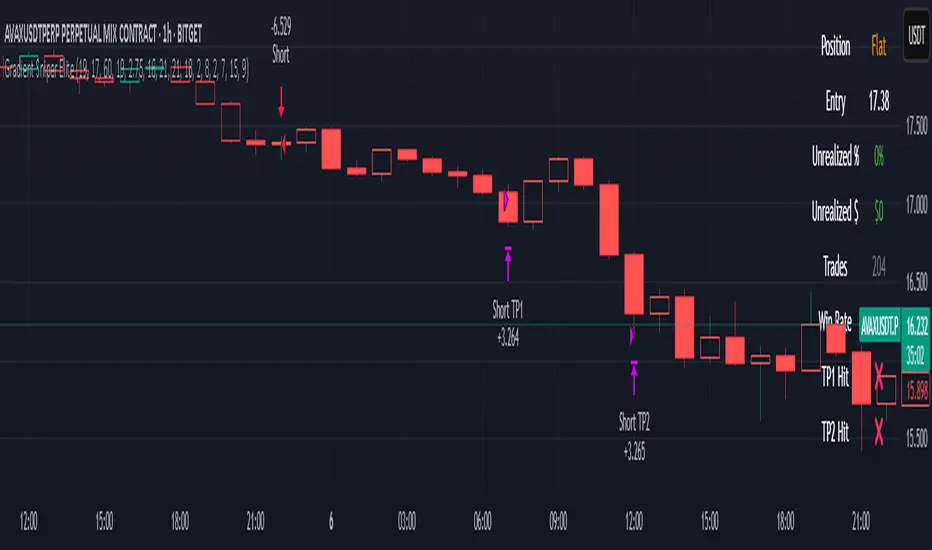
Apex Trend SniperApex Trend Sniper - Advanced Trend Trading Strategy (Pine Script v5)
🚀 Overview
The Apex Trend Sniper is an advanced, fully automated trend-following strategy designed for crypto, forex, and stock markets. It combines momentum analysis, trend confirmation, volume validation, and adaptive risk management to capture high-probability trades. Unlike many strategies, this system is 100% non-repainting, ensuring reliable backtesting and real-time execution.
🔹 How This Strategy Works (Indicator Mashup)
The Apex Trend Sniper leverages multiple indicators to create a robust multi-layered confirmation system:
1️⃣ Trend Identification with RMI & McGinley Dynamic
📌 What It Does: Identifies the dominant trend and prevents trading against market conditions.
✔ McGinley Dynamic Baseline:
A highly adaptive moving average that dynamically reacts to price changes.
Price above the baseline = bullish trend.
Price below the baseline = bearish trend.
✔ Relative Momentum Index (RMI):
A refined Relative Strength Index (RSI) that filters out weak trends.
Above 50 = bullish confirmation.
Below 50 = bearish confirmation.
2️⃣ Trend Strength Confirmation with Vortex Indicator
📌 What It Does: Confirms that a detected trend is strong and valid.
✔ Vortex Indicator (VI):
Measures directional movement and trend strength.
A bullish trend is confirmed when VI+ > VI-.
A bearish trend is confirmed when VI- > VI+.
3️⃣ Volume Spike Detection for Trade Validation
📌 What It Does: Ensures that trades are placed only during strong market participation.
✔ Volume Confirmation:
A trade signal is only valid if volume spikes above the moving average.
Helps avoid false breakouts and weak trends.
4️⃣ Entry & Exit Strategy with Multi-Level Take Profits
📌 What It Does: Enters trades only when all conditions align and manages risk effectively.
✔ Entry Conditions (All must be met):
Price is above/below McGinley Dynamic.
RMI confirms trend direction.
Vortex indicator confirms trend strength.
Volume spike is detected.
✔ Exit Conditions:
Take Profit 1 (TP1): Secures 50% of the position at the first price target.
Take Profit 2 (TP2): Closes the remaining position at the second price target.
Exit Before Reversal: If an opposite trend signal appears, the position is closed early.
Trend Weakness Exit: If momentum weakens, the trade is exited automatically.
📌 Strategy Customization
🔧 Fully customizable to fit any trading style:
✔ McGinley Dynamic Length – Adjust baseline sensitivity.
✔ RMI & Vortex Settings – Fine-tune momentum filters.
✔ Volume Thresholds – Modify spike detection for better accuracy.
✔ Take Profit Levels – Set TP1 & TP2 based on market volatility.
📢 How to Use Apex Trend Sniper
1️⃣ Apply the strategy to any TradingView chart.
2️⃣ Customize the settings to fit your trading approach.
3️⃣ Use the backtest report to evaluate performance.
4️⃣ Monitor the dashboard to track real-time trade execution.
📌 Recommended Timeframes & Markets
✔ Best Markets:
✅ Crypto (BTC, ETH, SOL, etc.)
✅ Forex (EUR/USD, GBP/USD, JPY/USD, etc.)
✅ Stocks & Indices (S&P500, NASDAQ, etc.)
✔ Optimal Timeframes:
✅ Swing Trading: 1H – 4H – 1D
✅ Intraday & Scalping: 5M – 15M – 30M
📌 Backtest Settings for Realistic Performance
✔ Initial Capital: $1000 (or more for scaling).
✔ Commission: 0.05% (to simulate exchange fees).
✔ Slippage: 1-2 (to account for execution delay).
✔ Date Range: Test across different market conditions.
📢 TradingView Disclaimer
📌 This script is for educational purposes only and does not constitute financial advice. Trading carries significant risk, and past performance does not guarantee future results. Always test strategies thoroughly before applying them in a live market. Users are responsible for their own trading decisions.
🚀 Why Choose Apex Trend Sniper?
✅ Non-Repainting – No misleading signals.
✅ Multi-Layer Confirmation – Reduces false trades.
✅ Volume & Trend Strength Validation – Ensures high-probability entries.
✅ Adaptive Risk Management – Secures profits while maximizing trends.
✅ Versatile Across Markets & Timeframes – Works for crypto, forex, and stocks.
📢 Start Trading Smarter with Apex Trend Sniper! 🚀
🔗 Try it now on TradingView and optimize your trend-following strategy. 🔥

Buy on 5% dip strategy with time adjustment
This script is a strategy called "Buy on 5% Dip Strategy with Time Adjustment 📉💡," which detects a 5% drop in price and triggers a buy signal 🔔. It also automatically closes the position once the set profit target is reached 💰, and it has additional logic to close the position if the loss exceeds 14% after holding for 230 days ⏳.
Strategy Explanation
Buy Condition: A buy signal is triggered when the price drops 5% from the highest price reached 🔻.
Take Profit: The position is closed when the price hits a 1.22x target from the average entry price 📈.
Forced Sell Condition: If the position is held for more than 230 days and the loss exceeds 14%, the position is automatically closed 🚫.
Leverage & Capital Allocation: Leverage is adjustable ⚖️, and you can set the percentage of capital allocated to each trade 💸.
Time Limits: The strategy allows you to set a start and end time ⏰ for trading, making the strategy active only within that specific period.
Code Credits and References
Credits: This script utilizes ideas and code from @QuantNomad and jangdokang for the profit table and algorithm concepts 🔧.
Sources:
Monthly Performance Table Script by QuantNomad:
ZenAndTheArtOfTrading's Script:
Strategy Performance
This strategy provides risk management through take profit and forced sell conditions and includes a performance table 📊 to track monthly and yearly results. You can compare backtest results with real-time performance to evaluate the strategy's effectiveness.
The performance numbers shown in the backtest reflect what would have happened if you had used this strategy since the launch date of the SOXL (the Direxion Daily Semiconductor Bull 3x Shares ETF) 📅. These results are not hypothetical but based on actual performance from the day of the ETF’s launch 📈.
Caution ⚠️
No Guarantee of Future Results: The results are based on historical performance from the launch of the SOXL ETF, but past performance does not guarantee future results. It’s important to approach with caution when applying it to live trading 🔍.
Risk Management: Leverage and capital allocation settings are crucial for managing risk ⚠️. Make sure to adjust these according to your risk tolerance ⚖️.

Advanced Adaptive Grid Trading StrategyThis strategy employs an advanced grid trading approach that dynamically adapts to market conditions, including trend, volatility, and risk management considerations. The strategy aims to capitalize on price fluctuations in both rising (long) and falling (short) markets, as well as during sideways movements. It combines multiple indicators to determine the trend and automatically adjusts grid parameters for more efficient trading.
How it Works:
Trend Analysis:
Short, long, and super long Moving Averages (MA) to determine the trend direction.
RSI (Relative Strength Index) to identify overbought and oversold levels, and to confirm the trend.
MACD (Moving Average Convergence Divergence) to confirm momentum and trend direction.
Momentum indicator.
The strategy uses a weighted scoring system to assess trend strength (strong bullish, moderate bullish, strong bearish, moderate bearish, sideways).
Grid System:
The grid size (the distance between buy and sell levels) changes dynamically based on market volatility, using the ATR (Average True Range) indicator.
Grid density also adapts to the trend: in a strong trend, the grid is denser in the direction of the trend.
Grid levels are shifted depending on the trend direction (upwards in a bear market, downwards in a bull market).
Trading Logic:
The strategy opens long positions if the trend is bullish and the price reaches one of the lower grid levels.
It opens short positions if the trend is bearish and the price reaches one of the upper grid levels.
In a sideways market, it can open positions in both directions.
Risk Management:
Stop Loss for every position.
Take Profit for every position.
Trailing Stop Loss to protect profits.
Maximum daily loss limit.
Maximum number of positions limit.
Time-based exit (if the position is open for too long).
Risk-based position sizing (optional).
Input Options:
The strategy offers numerous settings that allow users to customize its operation:
Timeframe: The chart's timeframe (e.g., 1 minute, 5 minutes, 1 hour, 4 hours, 1 day, 1 week).
Base Grid Size (%): The base size of the grid, expressed as a percentage.
Max Positions: The maximum number of open positions allowed.
Use Volatility Grid: If enabled, the grid size changes dynamically based on the ATR indicator.
ATR Length: The period of the ATR indicator.
ATR Multiplier: The multiplier for the ATR to fine-tune the grid size.
RSI Length: The period of the RSI indicator.
RSI Overbought: The overbought level for the RSI.
RSI Oversold: The oversold level for the RSI.
Short MA Length: The period of the short moving average.
Long MA Length: The period of the long moving average.
Super Long MA Length: The period of the super long moving average.
MACD Fast Length: The fast period of the MACD.
MACD Slow Length: The slow period of the MACD.
MACD Signal Length: The period of the MACD signal line.
Stop Loss (%): The stop loss level, expressed as a percentage.
Take Profit (%): The take profit level, expressed as a percentage.
Use Trailing Stop: If enabled, the strategy uses a trailing stop loss.
Trailing Stop (%): The trailing stop loss level, expressed as a percentage.
Max Loss Per Day (%): The maximum daily loss, expressed as a percentage.
Time Based Exit: If enabled, the strategy exits the position after a certain amount of time.
Max Holding Period (hours): The maximum holding time in hours.
Use Risk Based Position: If enabled, the strategy calculates position size based on risk.
Risk Per Trade (%): The risk per trade, expressed as a percentage.
Max Leverage: The maximum leverage.
Important Notes:
This strategy does not guarantee profits. Cryptocurrency markets are volatile, and trading involves risk.
The strategy's effectiveness depends on market conditions and settings.
It is recommended to thoroughly backtest the strategy under various market conditions before using it live.
Past performance is not indicative of future results.

Simple APF Strategy Backtesting [The Quant Science]Simple backtesting strategy for the quantitative indicator Autocorrelation Price Forecasting. This is a Buy & Sell strategy that operates exclusively with long orders. It opens long positions and generates profit based on the future price forecast provided by the indicator. It's particularly suitable for trend-following trading strategies or directional markets with an established trend.
Main functions
1. Cycle Detection: Utilize autocorrelation to identify repetitive market behaviors and cycles.
2. Forecasting for Backtesting: Simulate trades and assess the profitability of various strategies based on future price predictions.
Logic
The strategy works as follow:
Entry Condition: Go long if the hypothetical gain exceeds the threshold gain (configurable by user interface).
Position Management: Sets a take-profit level based on the future price.
Position Sizing: Automatically calculates the order size as a percentage of the equity.
No Stop-Loss: this strategy doesn't includes any stop loss.
Example Use Case
A trader analyzes a dayli period using 7 historical bars for autocorrelation.
Sets a threshold gain of 20 points using a 5% of the equity for each trade.
Evaluates the effectiveness of a long-only strategy in this period to assess its profitability and risk-adjusted performance.
User Interface
Length: Set the length of the data used in the autocorrelation price forecasting model.
Thresold Gain: Minimum value to be considered for opening trades based on future price forecast.
Order Size: percentage size of the equity used for each single trade.
Strategy Limit
This strategy does not use a stop loss. If the price continues to drop and the future price forecast is incorrect, the trader may incur a loss or have their capital locked in the losing trade.
Disclaimer!
This is a simple template. Use the code as a starting point rather than a finished solution. The script does not include important parameters, so use it solely for educational purposes or as a boilerplate.
